Centralized Monitoring on an AWS EKS Cluster Using Helm Chart: Prometheus, Grafana, and Alert Manager.

Successfully deploying a Kubernetes cluster is a notable achievement, but maintaining its optimal performance and reliability demands continuous attention. Implementing a robust monitoring system is essential for sustaining the health and efficiency of your cluster. By tracking resource utilization, proactively identifying potential issues, and gaining insights into application behavior, you can effectively manage your Kubernetes infrastructure.
To gain comprehensive insights into your Kubernetes cluster’s health, performance, and resource consumption, Prometheus is an invaluable tool. This open-source system collects and stores metrics from various sources within your cluster. Its versatile query language enables data analysis and alert setup to address potential issues proactively. For Software Reliability Engineers (SREs), Prometheus and Grafana form a powerful combination for measuring the Site Reliability Index (SRI). Beyond collecting performance metrics, this dynamic duo allows SREs to create custom dashboards, visualize data in real time, and establish alerts for proactive issue detection using Alertmanager.
This article will guide you through setting up a centralized monitoring solution for your AWS EKS cluster using Helm. We will use Prometheus for metrics collection, Grafana for visualization, and Alertmanager for managing alerts.
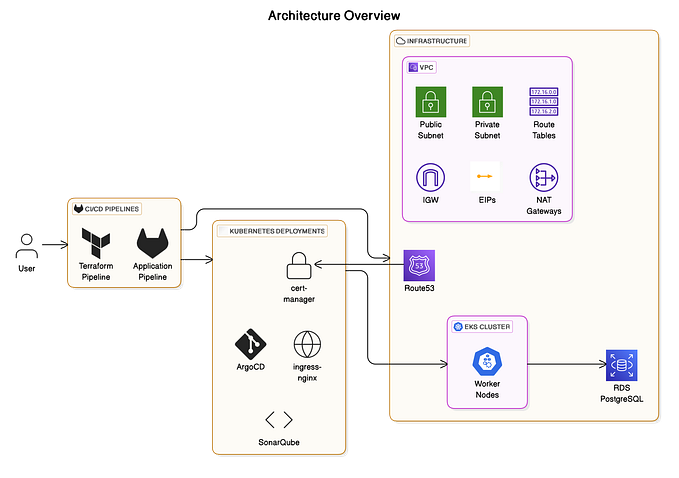
Architecture Overview
The proposed architecture consists of the following components:
- Prometheus: Collects metrics from various sources within the cluster.
- Grafana: Visualizes and analyzes collected metrics.
- Alertmanager: Handles alerts generated by Prometheus and routes them to appropriate recipients.
- kube-state-metrics: Exposes Kubernetes metadata as Prometheus metrics.
- node-exporter: Exposes system-level metrics from each node.
Prerequisites
Before we begin, make sure you have the following prerequisites in place:
- An AWS account.
- An EKS cluster is up and running.
- kubectl configured to interact with your EKS cluster.
- Helm installed on your local machine.
Need a Kubernetes cluster? If you’re starting from scratch, check out my previous article for a step-by-step guide. For a quicker setup, explore my GitHub repo where I have pre-configured a Terraform module to streamline the process.
Step 1: Installation of Prometheus, Grafana and Alertmanager.
To install Prometheus on Kubernetes using the Helm chart, you first need to install the Helm. Once Helm is installed, configure the Prometheus community repository with the following commands:
# Add the latest HELM repository in Kubernetes:
$ helm repo add stable https://charts.helm.sh/stable

# Add the Prometheus repository to HELM:
$ helm repo add prometheus-community https://prometheus-community.github.io/helm-charts

# Update the helm repo:
$ helm repo update
We will deploy the Prometheus server and its components, along with Grafana, to this cluster using the prometheus-community/kube-prometheus-stack Helm chart. We will create a dedicated namespace called monitoring to isolate our Prometheus stack resources within the cluster.
#Deploy prometheus, grafana and alert manager in a namespace called monitoring:
$ helm install prometheus-stack prometheus-community/kube-prometheus-stack -n monitoring --create-namespace

# Execute the following command to list all the Kubernetes resources created in the monitoring namespace
kubectl get all -n monitoring 
Step 2. Exposing the services using values.yaml File.
To make Prometheus, Alertmanager, and Grafana accessible outside the Kubernetes cluster, we need to expose their services using NodePort.
We created a values.yaml file to expose the service using NodePort. Although exposing services using NodePort is not recommended for production environments, it is used here for demonstration purposes.
# values.yaml
prometheus:
  service:
    type: NodePort
    nodePort: 30091  # specify a nodePort if needed, or let Kubernetes assign one automatically

alertmanager:
  service:
    type: NodePort
    nodePort: 30092 # specify a nodePort if needed, or let Kubernetes assign one automaticall

grafana:
  service:
    type: NodePort
    nodePort: 30093  # specify a nodePort if needed, or let Kubernetes assign one automatically
To apply the change, execute ;
$ helm upgrade prometheus-stack prometheus-community/kube-prometheus-stack -f prometheus-values.yaml -n monitoring

# Execute this to confirm the Kubernetes service type that was updated in the monitoring namespace
kubectl get svc -n monitoring
N.B — By default, the Prometheus-community/Kube-Prometheus-stack includes predefined alert rules. While these can be disabled to define your own custom rules, for this implementation, we will utilize the predefined alert rules provided by the kube-prometheus-stack.


STEP 3. Import the Kubernetes Dashboard to grafana
- Log in to your Grafana dashboard using your credentials. The default username is
admin, but to retrieve the default password, you need to run the following command;
# Retrieve default password
kubectl get secret --namespace monitoring prometheus-stack-grafana -o jsonpath="{.data.admin-password}" | base64 --decode ; echo

Default password - prom-operator
2. Go to the Grafana dashboard section and click on “Import”.
- You can import a pre-built Kubernetes Dashboard from the Grafana dashboard library. The dashboard ID
315is a popular choice for Kubernetes metrics. - Enter the dashboard ID and click “Load”.
3. Configure Data Source
- Ensure that your data source is set to
Prometheus. The Kube Prometheus Stack typically configures Prometheus as the default data source, but you may need to select it manually in the dashboard settings if not available. - You can verify this by going to Configuration > Data Sources in Grafana and checking that Prometheus is configured.
- After importing the dashboard, you should see various panels displaying Kubernetes metrics such as CPU usage, memory usage, pod health, etc.

N.B — The Kube Prometheus Stack includes preconfigured dashboards by default. You can customize and adapt these dashboards according to your specific business or individual requirements
KNOWN ISSUE

Workaround — To enhance the reliability and performance of alert handling in the Kube Prometheus Stack, running multiple Alertmanager replicas is recommended. A single replica can become overwhelmed under heavy alert loads, leading to delays or service disruptions. Provisioning multiple replicas reduces the risk, improving overall system resilience and responsiveness.
# specify
alertmanager:
 # Add this block to your values.yaml file to resolve the issue.
    alertmanagerSpec:
replicas: 2 
Happy Monitoring !!
Github repo
PREVIOUS ARTICLE